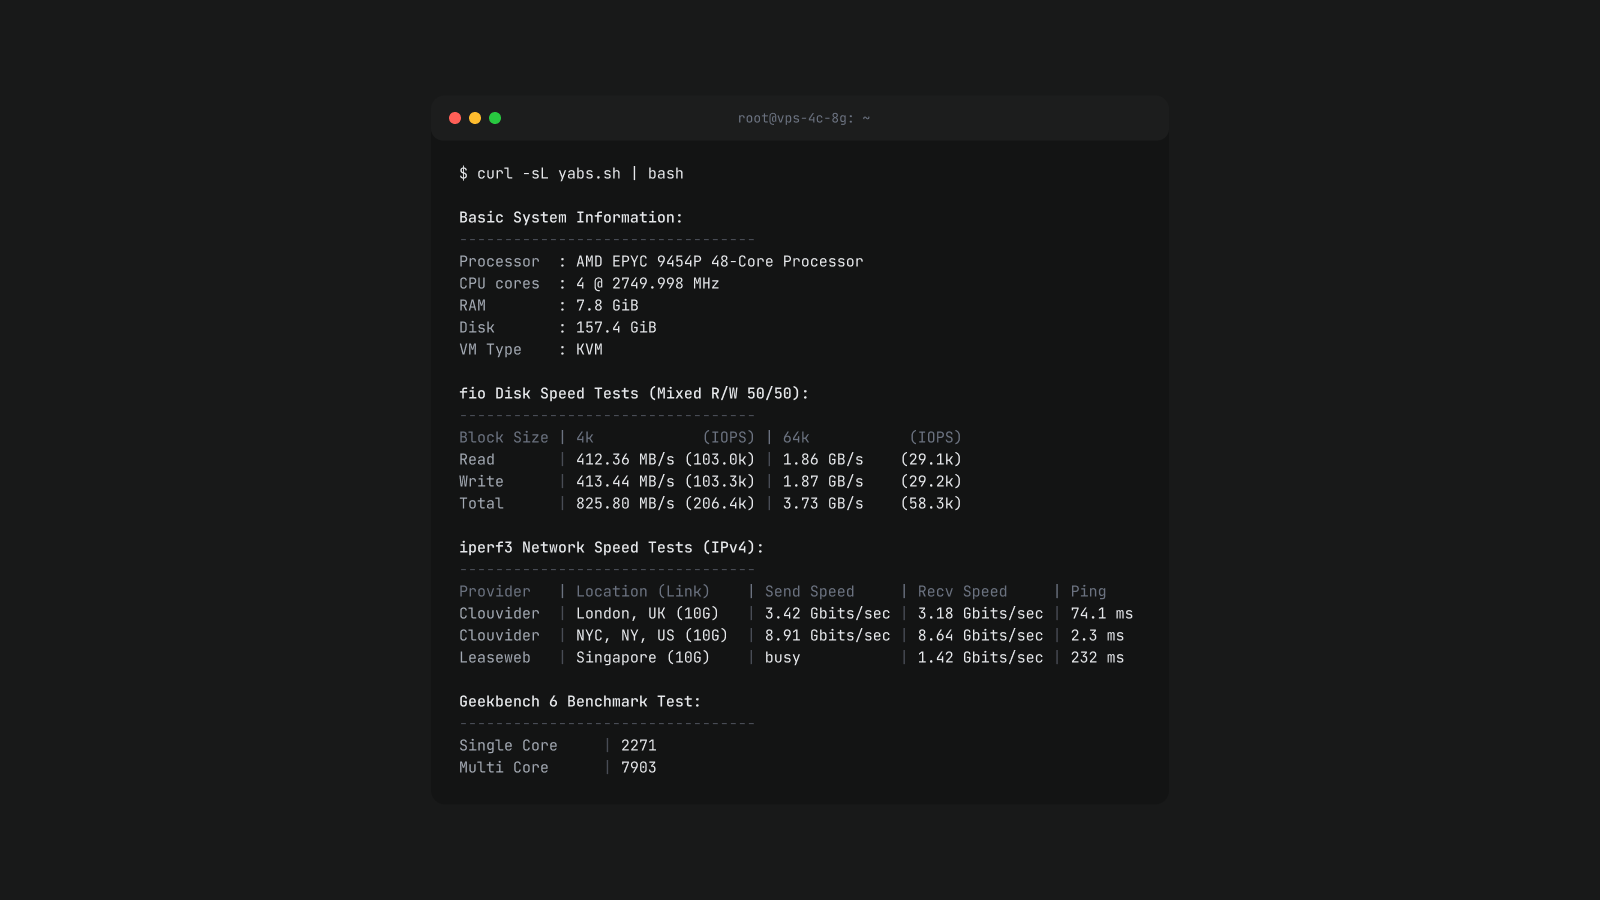
A benchmark tells you how good your VPS actually is; from CPU to disk and network. This guide walks through how to run standard testing with one command, how to read what it prints, and how to get numbers you can fairly compare across providers.
The short version
Log in to the server as any user and run:
1curl -sL yabs.sh | bash
This runs YABS (Yet Another Bench Script), the script most of the VPS community uses to compare servers. It needs no root access and installs nothing permanently. It tests three things:
Test | Tool | What it measures |
|---|---|---|
Disk | fio | Random read and write speed at 4k, 64k, 512k and 1m block sizes, 50% reads and 50% writes |
Network | iperf3 | Download and upload speed to public test servers in several regions |
CPU and Memory | Geekbench 6 | Single-core and multi-core scores you can compare with any other machine |
A full run takes a few minutes. The network test pushes the port as hard as it can for about 20 seconds per location, so don't run it on a server that's serving production traffic.
Read the script before you run it
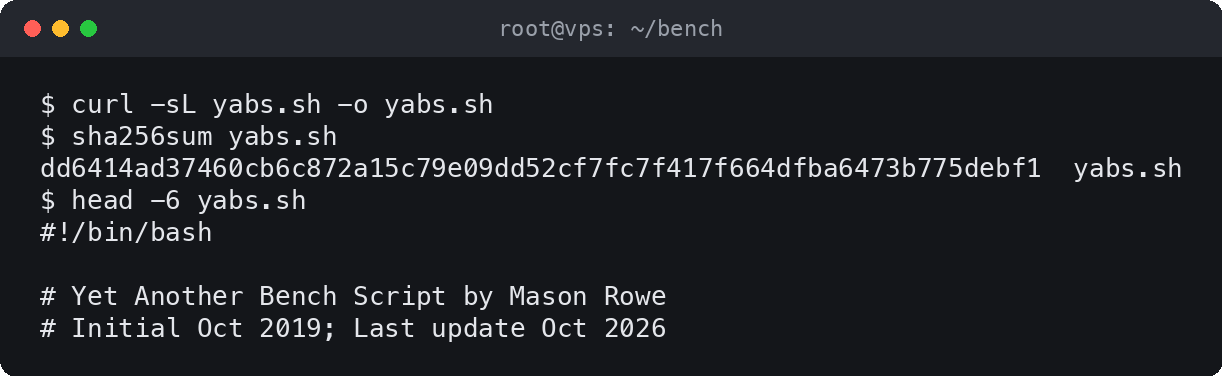
Piping a script from the internet straight into runs whatever it contains. YABS is widely used and open source, but you should still read it first on any server that matters:
1curl -sL yabs.sh -o yabs.sh2less yabs.sh3bash yabs.sh
YABS downloads prebuilt fio and iperf3 binaries, and a Geekbench tarball, at run time. If fio or iperf3 is already installed, YABS uses the local copy instead.
What to measure and why
Each part of the result answers a different question about the server.
- Single-core CPU decides how fast one request, build step or query runs. Most web apps and databases care about this number more than any other.
- Multi-core CPU decides how much parallel work the server can do at once, such as builds, video encoding or many concurrent users.
- 4k random disk shows how the disk handles the small, scattered reads and writes a database makes. It's the best single sign of whether the storage is fast or contended.
- 1m disk shows sequential throughput: backups, large file copies and media.
- Network shows how fast the server can move data to the rest of the internet, which matters for downloads, backups and serving large files.
- Consistency is the number most benchmarks skip. A server that scores well once and poorly an hour later has neighbours competing for the same hardware.
Choose what to test with flags
Pass flags after to skip tests or change what runs:
1curl -sL yabs.sh | bash -s -- -i
Flag | What it does |
|---|---|
-i | Skips the network test. Use this on metered or low-bandwidth servers. |
-r | Tests against fewer network locations, to use less bandwidth. |
-f | Skips the disk test. |
-g | Skips Geekbench. |
-7 | Runs Geekbench 7 instead of Geekbench 6. |
-j | Prints the results as JSON as well. |
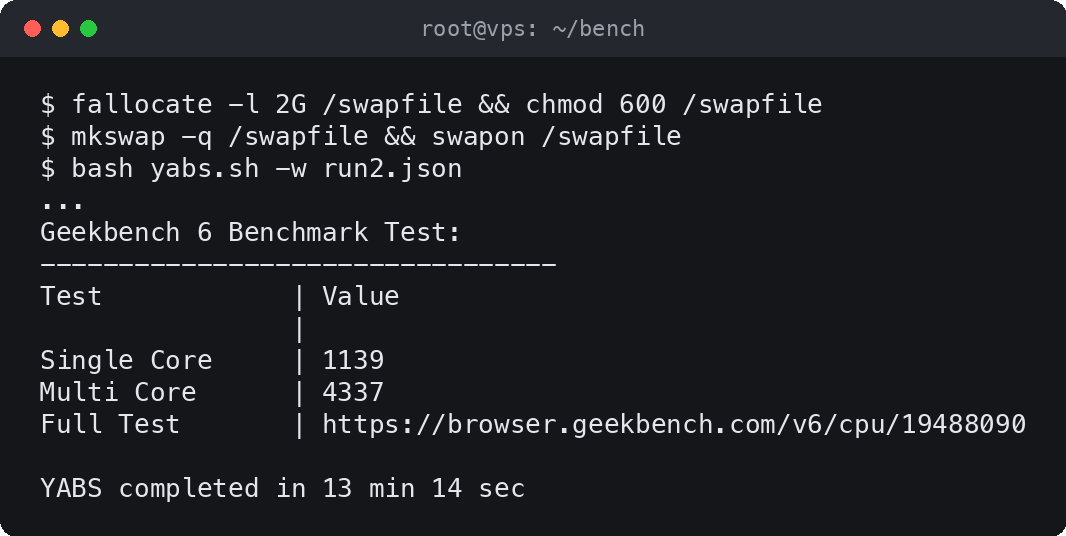
-w results.json | Writes the JSON results to a file. |
You can combine flags. skips both disk and Geekbench, so only the network test runs.
Geekbench 6 is the default because most published results use it. Only compare a Geekbench 6 score with other Geekbench 6 scores; versions score differently.
Read the output
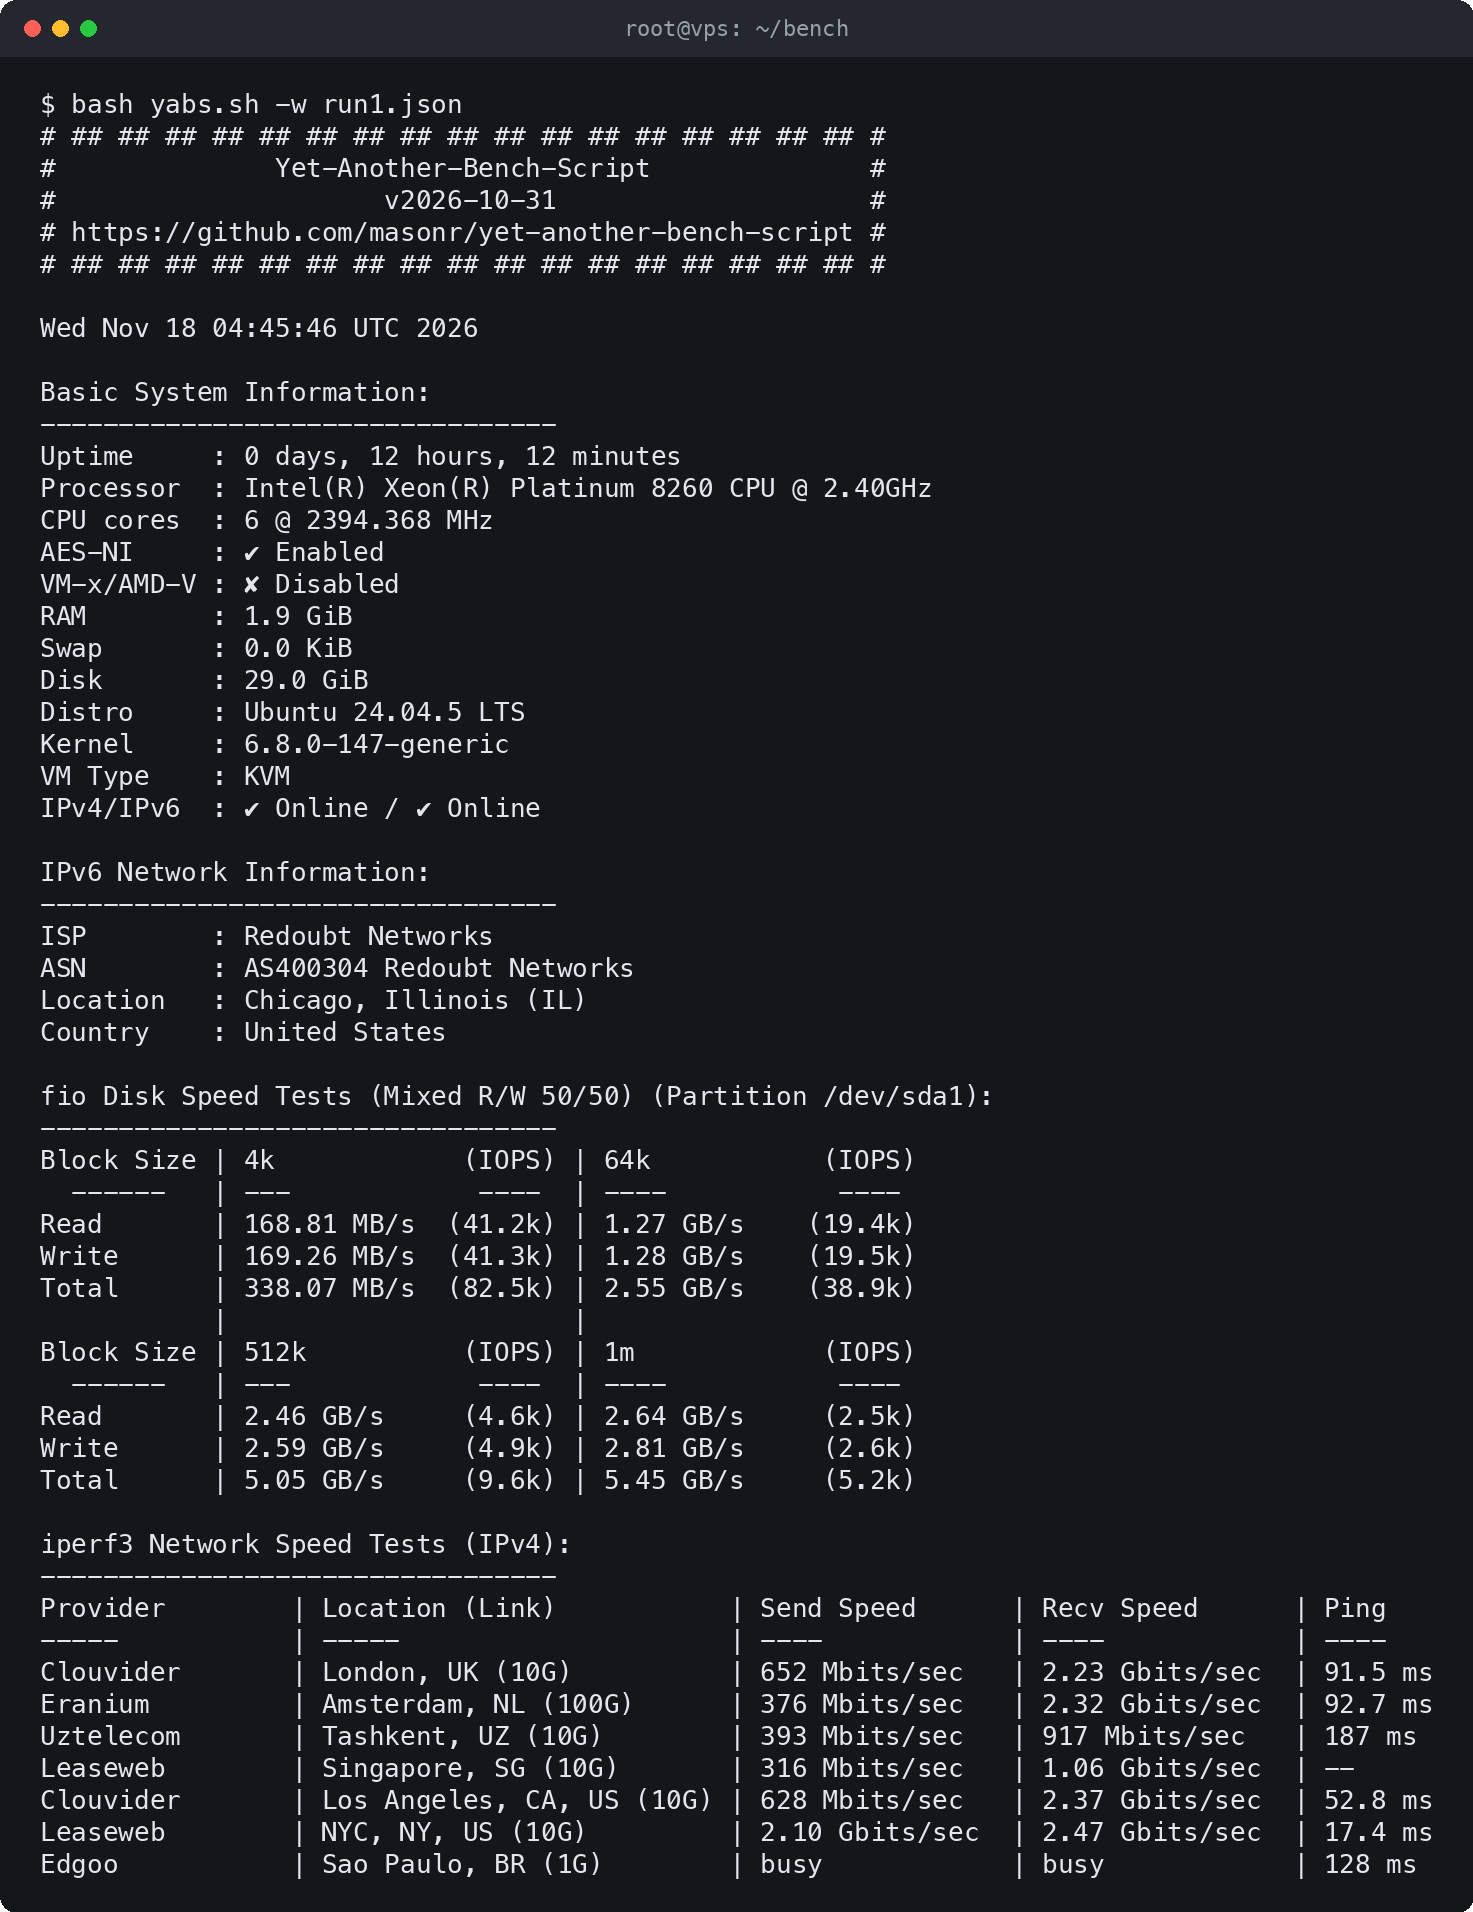
Here's what each section tells you.
Basic System Information lists the CPU model, core count, RAM and disk the server reports. Check the CPU model against what the provider advertises. shows the virtualization, such as .
fio Disk Speed Tests shows throughput and IOPS at each block size. Look at the 4k column first. Compare it with results from other servers of the same price and disk type rather than an absolute number: NVMe on a quiet host should beat SATA SSD, and both should be far ahead of network storage.
iperf3 Network Speed Tests shows send and receive speed per location. Results drop with distance, so a US server is slower to Europe than to New York. A busy test server is skipped and shows , which isn't a fault on your side.
Geekbench 6 shows single-core and multi-core scores, plus a link to the full result on the Geekbench website. Open the link and compare your score with others from the same CPU model. A score well below others on the same CPU suggests the host is oversubscribed or the cores are shared.
Go deeper
YABS gives you a broad picture. When one part of it matters most for your workload, test that part directly.
Database-style disk load
This fio job mimics a database: random 4k reads and writes, 70% reads, with several requests in flight. Run it in a directory on the disk you want to test:
1fio --name=dbtest --rw=randrw --rwmixread=70 --bs=4k --size=2G \2 --iodepth=32 --numjobs=4 --direct=1 --runtime=60 --time_based \3 --group_reporting --ioengine=libaio4rm -f dbtest.*
bypasses the page cache, so you measure the disk rather than RAM. Read the `IOPS` line for reads and writes, and the `clat` percentiles for latency. A high 99th percentile latency hurts a database more than a low average IOPS.
CPU steal
On shared CPU plans, the host divides physical cores between several servers. Steal is the share of time your server wanted the CPU and had to wait. Watch it while the server is busy:
1vmstat 1 30
The column is steal, as a percentage. Values that stay near zero are normal. Steal that is regularly above a few percent means other tenants are competing for your cores, and your app will feel slower at those times. (from the package) shows the same figure as .
Dedicated CPU plans don't share cores, so steal stays at zero. If your workload is latency-sensitive, compare a run on a shared VPSwith one on a dedicated-core VDS.
Network to your own users
The public iperf3 servers YABS uses tell you about the provider's upstream, not the path to your users. To test that path, run an iperf3 server on a machine near your users and test against it:
On a machine near your users:
1iperf3 -s
On the VPS:
1iperf3 -c <that machine's IP> -P 4 -t 302iperf3 -c <that machine's IP> -P 4 -t 30 -R
reverses the direction, so the second command measures the VPS's download speed. For latency alone, shows the delay and loss at each hop.
Get results you can trust
One run is a snapshot. To compare providers fairly:
- Test an idle server. Stop your own services first, or test a fresh server before you deploy anything.
- Run it at least three times, at different hours. Neighbours on shared hardware are busiest at different times of day. Report the median and note how far the runs spread.
- Compare like with like. Use the same plan size, region type, virtualisation and Geekbench version.
- Note the region. Network results depend heavily on where the server and test endpoints are.
- Save the JSON. keeps the raw numbers, so you can compare later runs without retyping anything.
Compare your results
Once you have numbers, compare them against other servers:
- YABSdb and VPSBenchmarks collect YABS results from many providers. YABS can submit to either with the flag.
- The LowEndTalk community has long-running threads where people post YABS results by provider.
- Our benchmark race runs the same tests on a similar-priced plan at several providers, including ours, on a schedule.
Frequently Asked Questions
Usually a few minutes. The network test takes the longest, at about 20 seconds per location. Skip it with `-i` if you only need disk and CPU numbers.
It runs whatever the script contains, so download it and read it first on any server that matters. YABS is open source and doesn't need root. It downloads fio, iperf3 and Geekbench binaries at run time.
Probably not. The disk test writes test files and the network test saturates the port, which slows down whatever else is running. Test before you deploy, or during a quiet window.
It depends on the CPU. Compare your score with others from the same CPU model on the Geekbench website. A score far below that range points to shared or oversubscribed cores.
Other servers on the same host share the storage, and caching affects short tests. Run the test several times at different hours and use the median. A large spread between runs is itself a result: it tells you the storage is contended.
Use Geekbench 6 unless you're comparing against results that used 7. Scores from different versions aren't comparable. YABS runs Geekbench 6 by default; add `-7` for Geekbench 7.
Only through WSL 2. It doesn't run on WSL 1 or natively on Windows.